DevOps is the unity of automated testing and deployment, monitoring, app telemetry, and agile processes on one team. DevOps puts aside the long prevailing idea that a deployment is a big deal that requires hours or days of multiple teams planning and talking. It allows for continuous delivery – a high performing DevOps team will roll out new features on a daily basis. Talk to any team member on a true DevOps team and they will rave about how awesome it feels to get features into the hands of a stakeholder so quickly.
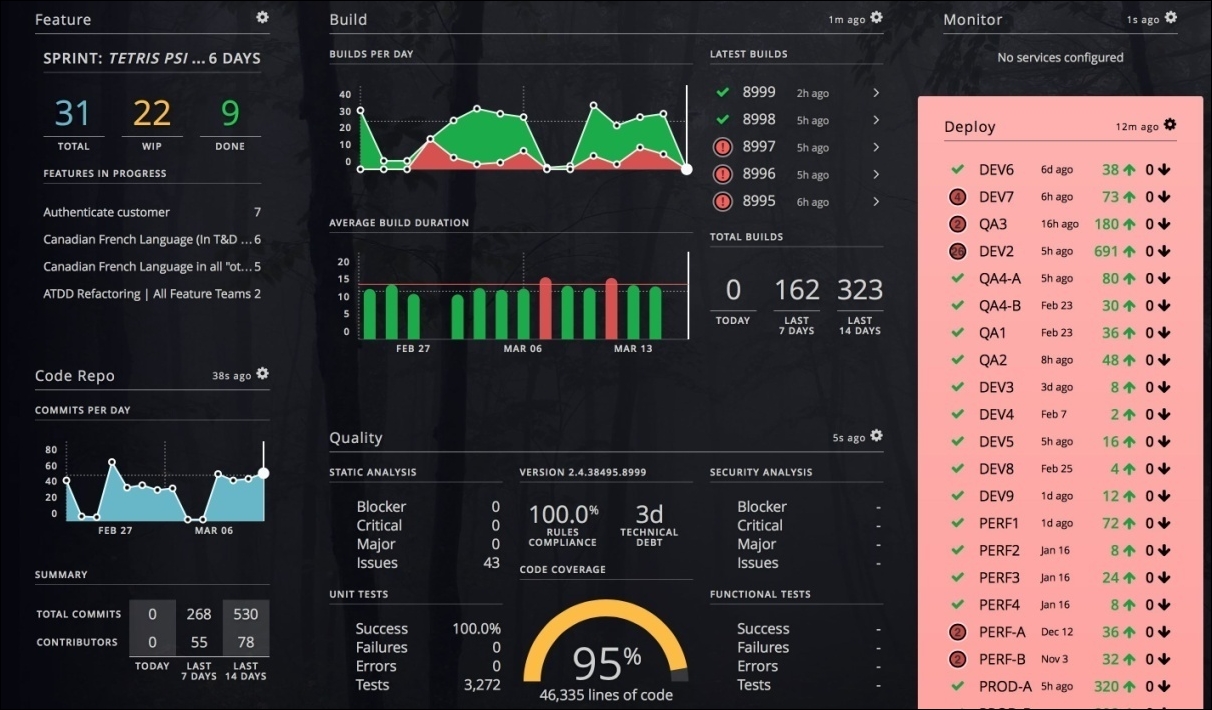
A DevOps team has a lot to worry about – is the app up right now? Is it performing well? Is the next release in a stable state? Are we going to get our sprint work done? How is the UX today? A DevOps dashboard can go a long way in answering all of the above in real time. A good one will show the following metrics:
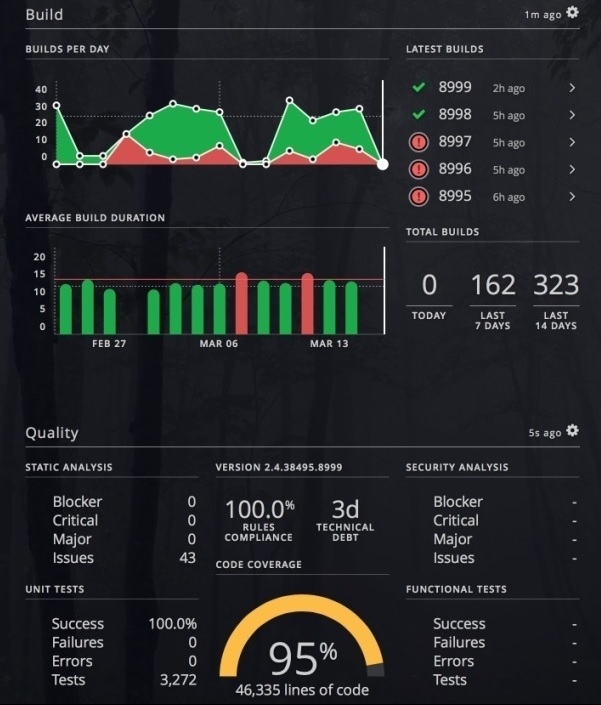
- Release pipeline – commits, build health, and automated test results
- Current sprint – days remaining in sprint, number of outstanding and completed sprint features
- App server health and availability – load, disk/memory use, api or site availability and response time
- App telemetry – examples would be quantity of products purchased over the last hour, number of errors encountered by users, etc.
Since DevOps is fairly new, these dashboards are somewhat of an emerging need and there’s not much out there in the way of a true DevOps dashboard. If you’re feeling ambitious you can code something from scratch. This is my preferred way as a strong dev team can do it quickly, you have complete control, and it’s fun. Platforms like Jenkins, JIRA, BitBucket, etc. have robust REST APIs that you can hook into to get real-time data. A dashboard stack can be pretty simple – technologies like Charts.js, Knockout, and Node or .NET Core WebAPI can be used. Building a DevOps dashboard can be a good go-to project if you have some downtime in between sprints.
A quicker, easier option is to use something that’s already out there, or a combination. Hygieia is an open-source dashboard that can provide great insight into your release pipeline. You could build that out, then set up a server/network monitoring dashboard like Cacti, and whip up a site that displays the two dashboards in iFrames – with a little jQuery script that cycles between the two. Not as powerful as a custom-built solution, but quick and easy.
WATCH: Continuous Delivery at Bing
Hygieia: